Knowing the coverage of your codebase means knowing which parts of your code are covered by tests. It also gives you insight into how well-covered all the logical flows in your code are.
By writing unit tests alongside your code, you take your first steps toward ensuring the quality of your code and reducing the number of bugs in your codebase. To make sure the quality of the tests is good, you can invite colleagues to peer review the tests, and collaborate with subject matter experts to ensure that your test scenarios are covering as many cases as possible and also the most important ones. Getting an overview of your code coverage is a great way to automate the quality control of your tests even further.
In this article, we’ll look at setting up automation to gather the code coverage of your C# codebase, inside your Azure Pipelines setup, and then send that data to Codecov, a service that specializes in analyzing code coverage.
You can follow along with the sample GitHub project set up for this article. The solution structure mimics a small real-world project, with different classes and types with varying levels of code coverage.
Test Coverage Locally
First, you need to prepare the codebase that you’ll be generating the code coverage for with the right NuGet packages.
The standard template for Visual Studio or the .NET CLI for creating a new xUnit test project will automatically add the package coverlet.collector to your test project. This is a framework for creating code coverage information for .NET.
To make sure you can use Coverlet to create the output in the format Codecov expects (OpenCover), you also need to add the NuGet package coverlet.msbuild to your test project.
You can verify that you’ve set everything up correctly in your test project by ensuring that you have at least one test in your project and then run the following command in your project:
dotnet test /p:CollectCoverage=true /p:CoverletOutputFormat=opencover
If everything was set up correctly, the output of the command will show you how many tests were run, their statuses and the code coverage analyzed in your test project. The command should also result in an XML file in your test project’s root folder named coverage.opencover.xml.
Analysis with Codecov
Codecov generated reports will help you navigate the multiple aspects of your source code’s code coverage. To dive deeper into the details of the code coverage information in this XML file, you’ll want to upload the file to Codecov.

To do this, first, sign in to Codecov, which can be done through your account on GitHub, GitLab, or Bitbucket. This will allow you to quickly navigate to the repository you want to work with within Codecov.
Under each repository, you’ll find the repository’s Upload Token, which you will need later when you configure your Azure Pipelines.
Configure Azure Pipelines
To ensure that your Azure Pipelines can send information to Codecov, you need to ensure that the pipeline has access to the codecov.exe-file provided by Codecov. The easiest way to get started with this is by adding the Codecov NuGet package to one of your projects.
For a more involved solution, you can install Codecov once on a build server you control, or at the start of a build, so that multiple steps in an advanced pipeline can use the same instance. One way to do this is by installing the Codecov Chocolatey package.
When this is in place, you need to create a new pipeline in Azure Pipelines.
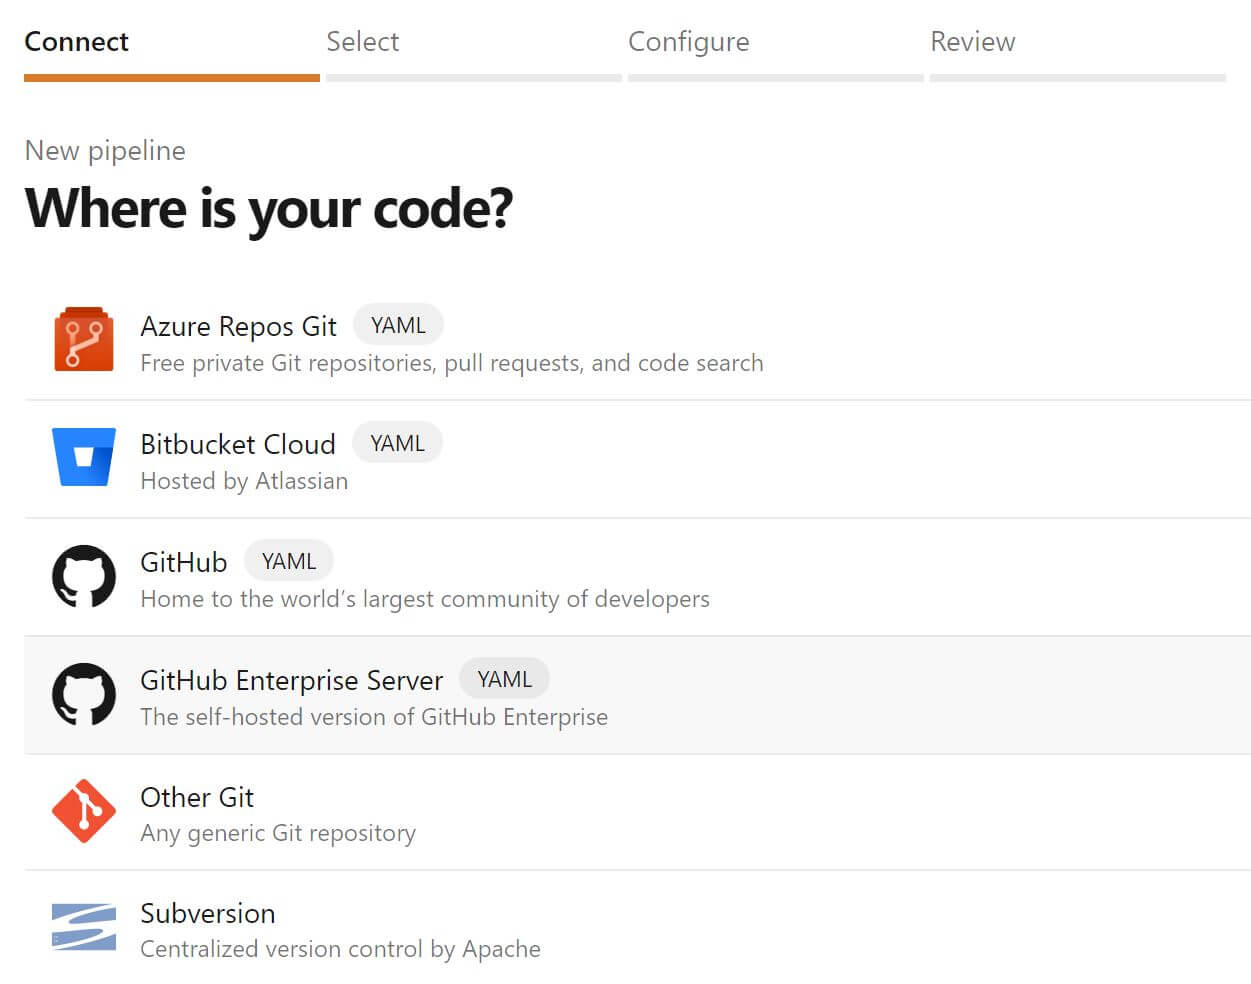
You will have to point your pipeline to the location of your repository. In this case, we’ll point it toward the azure-pipelines.yml file, in the sample GitHub repository.
Here are the most important parts of the azure-pipelines.yml file:
pool:
  vmImage: 'windows-latest'

variables:
  codecovVersion: '1.12.4'
  testProject: 'CodecovCsharpAzurePipelines.Tests'

steps:
- task: DotNetCoreCLI@2
  inputs:
    command: 'restore'
  displayName: '.NET Restore'

- task: DotNetCoreCLI@2
  inputs:
    command: 'test'
    arguments: './test/$(testProject)/$(testProject).csproj -c Debug /p:CollectCoverage=true /p:CoverletOutputFormat=opencover'
  displayName: '.NET Test'

- script: |
    %USERPROFILE%\.nuget\packages\codecov\$(codecovVersion)\tools\codecov.exe -f "./test/$(testProject)/coverage.opencover.xml" -t $(CODECOV_TOKEN)
  displayName: 'Codecov'
Under pool, you can see that you’re using the latest Windows version provided by Azure Pipelines, since you’re targeting an .exe file coming from Codecov. This also ensures that potentially dynamic values are easily modified under variables, with the version of the Codecov NuGet package you’re using and the project name of the test project to use.
The steps start off restoring the NuGet packages of the solution and then proceed to run the dotnet test command with the correct parameters to create the coverage information into the XML file, which under the script step is then sent to Codecov. This is done by pointing to the codecov.exe-file in the correct NuGet-path on the disk. The -t-parameter is used to inject the Upload Token you get when you navigate your repository in Codecov.
Next, you need to add a variable for your pipeline with the name CODECOV_TOKEN and the value for the Upload Token found in Codecov.
View Code Coverage
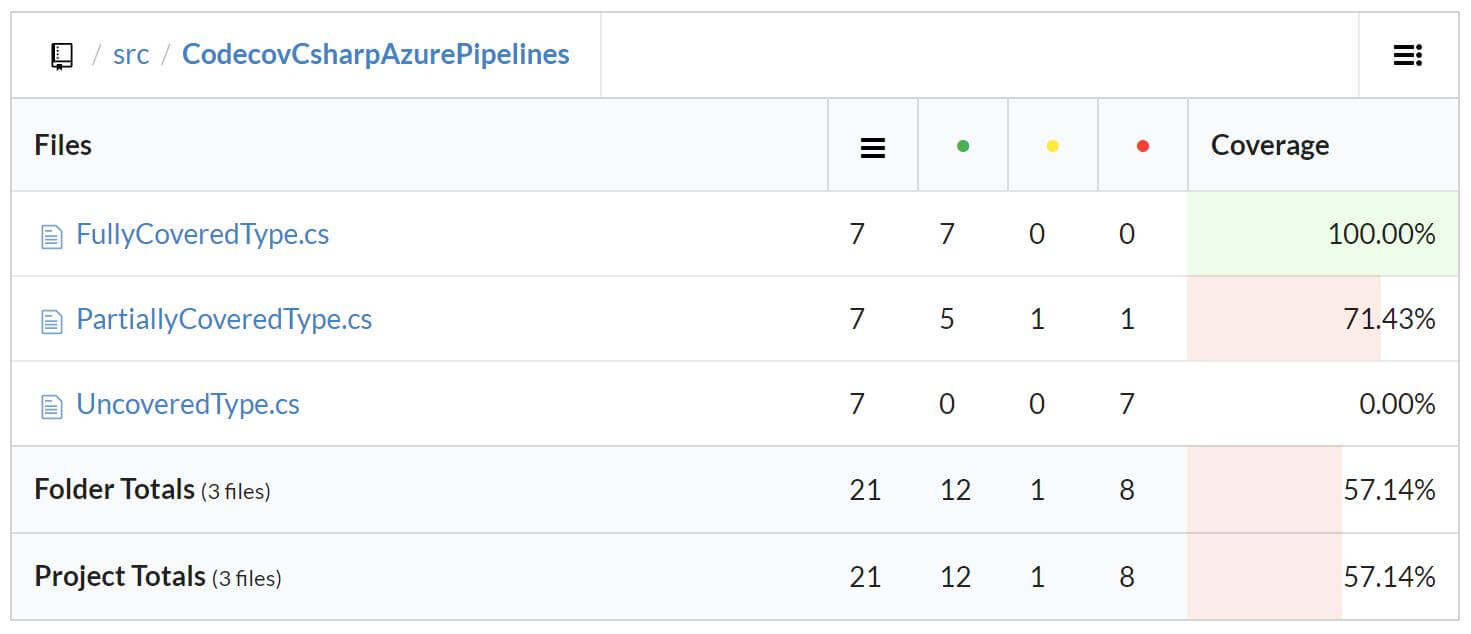
When your first build has passed successfully, you can start navigating your code in Codecov. You will quickly find that Codecov functionality is similar to GitHub, where you can see your commits, branches, and pull requests. Codecov, gives you additional code coverage-related data added to these views.
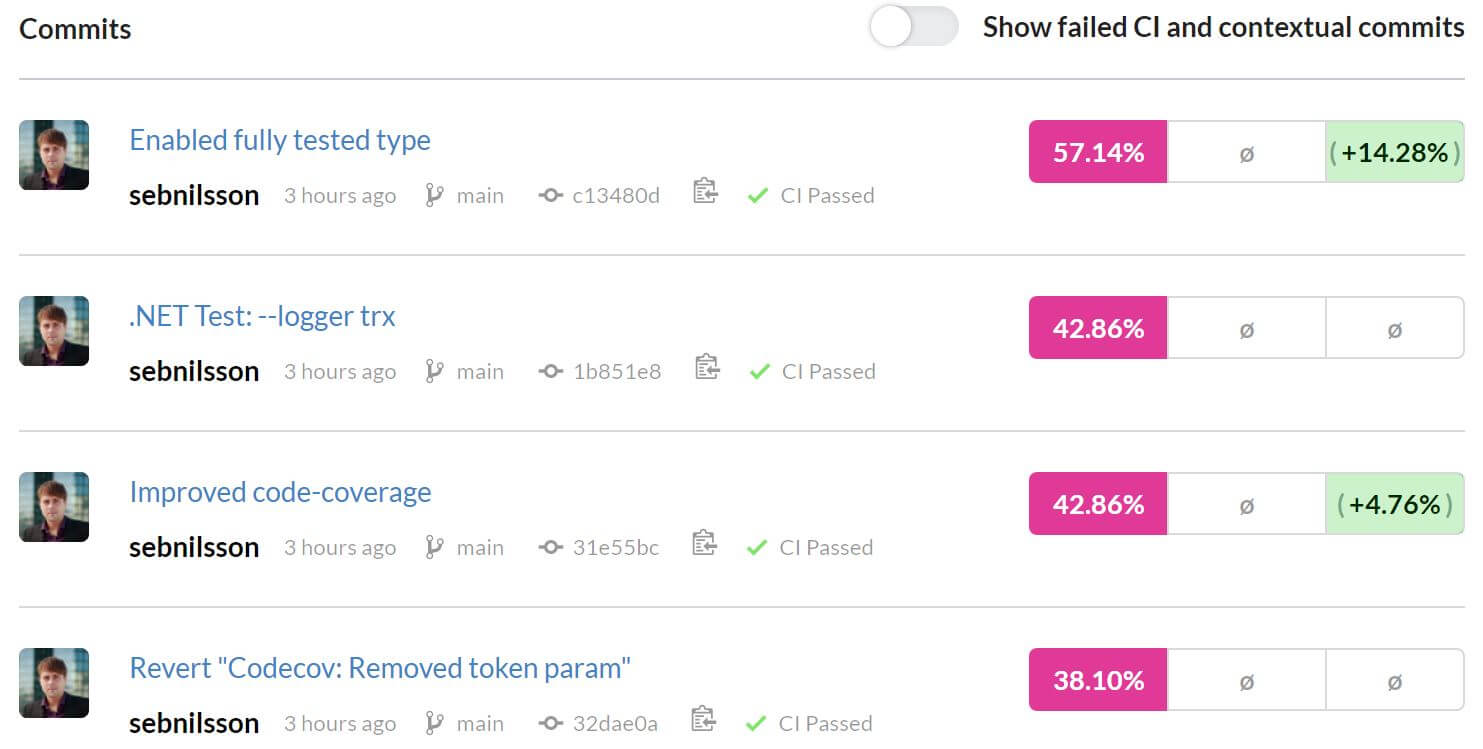
From the overview, you can drill down into the code and get a summary of the code coverage of the individual files in your codebase. There you can see, per file, the number of lines of code tracked for coverage, as well as how many are covered, partly covered, or not covered at all, along with a percentage of code coverage per file, folder, and project.
This will help you get a good overview of the state of your code, with useful references to the specific section you’re looking at and the project overall.
Conclusion
Having a check on your code coverage is crucial for any mature codebase. It enables you to have a more objective measurement of the quality of your unit tests and their test coverage of your code. It also helps you find blind spots in your code, which might not have enough testing scenarios to discover less-than-obvious bugs.
To analyze code coverage effectively, especially over time, you need tools to help you drill down into your code coverage reports. This helps you see parts of your codebase that can be improved as well as degradations of quality. This is where Codecov comes in. With Codecov, you can track the current state of your coverage and how it develops over time, directly in your workflow.