Code coverage is a metric for how much of your codebase gets executed when you run your tests. Basically, it tells you how much of your code is covered by tests and, more important, helps you locate lines in your code that aren’t covered.
In this tutorial, we’ll use a Python package called Coverage to generate a code coverage report locally. Then we’ll utilize the power of Codecov along with GitHub Actions to integrate our coverage report into our pull requests. The code repository is available here or you can follow along to replicate it yourself.
Generating a Report and Viewing It Locally
You’ll be working with this small program that simulates dice, to see how code coverage can help you better test it.
from random import randint

class RollableDie:
    def __init__(self, sides=6):
        self.sides = sides

    def roll(self):
        return randint(1, self.sides)

class DiceBag:
    def __init__(self, dice_sides=[]):
        self.dice = self.create_dice_from_sides(dice_sides)

    def create_dice_from_sides(self, sides):
        return list(map(lambda side: RollableDie(side), sides))

    def roll_bag(self):
        return list(map(lambda dice: dice.roll(), self.dice))
Pretend you’re a lazy developer (unheard of I know), and you’ve only written one test for this project.
class TestDie(unittest.TestCase):
    def setUp(self):
        self.die = RollableDie()

    def test_upper(self):
        self.assertEqual(self.die.sides, 6)
To get started, install coverage with pip install coverage.
If you run your tests with python -m unittest test.py, you can see that the one test passes. To get a local report, rerun the tests with coverage run -m unittest test.py.
This will run the tests as before, but it will also generate a new file called .coverage. You can’t open this file directly in your code editor, but you can use it to generate a report in console by running coverage report.
Name                       Stmts   Miss  Cover
----------------------------------------------
dice_package/__init__.py       0      0   100%
dice_package/dice.py          13      4    69%
test/__init__.py               0      0   100%
test/test_die.py               7      0   100%
----------------------------------------------
TOTAL                         20      4    80%
It looks like coverage is taking your test code into consideration when calculating the report. Don’t worry about that for right now. We’ll take care of that when we set up Codecov in the next step.
Pushing Your Project to GitHub and Codecov
The real power of code coverage comes when you can integrate it into your team’s everyday workflow. This is where Codecov comes in, making this integration a breeze.
- Navigate to codecov.io and click Sign Up. You’ll be given the option to sign up with GitHub, Bitbucket, or GitLab. Once you log in, you’ll see a list of repos from your GitHub account.
- Choose the repo you’d like to link with your Codecov account. You’ll be provided with a token. In some cases, you would need to use this token when uploading data from your repo to Codecov, but since you’re using a public repo here with GitHub Actions, you won’t need to provide the token. If you do decide to make your repo private in the future, you can always access this token again in the project’s settings section on the Codecov website.
Now that you’re set up on Codecov, it’s time to create a GitHub Action. This will be a three-step process every time you push a branch:
- Run your tests with coverage just like you did locally.
- Create the coverage report.
- Push that report up to Codecov so you can view your data and make it available as a graph in your pull request.
If you’ve never worked with GitHub Actions before, this tutorial is a great introduction. But to put it simply, you can control everything with a simple YAML config file. You can call the file whatever you want, but it needs to be in the .github/workflows directory, for example, .github/workflows/workflow.yml. Then, include the following code:
name: CodeCov
on: [push, pull_request]
jobs:
  run:
    runs-on: ubuntu-latest
    env:
      OS: ubuntu-latest
      PYTHON: '3.9'
    steps:
    - uses: checkout@v2
      with:
        fetch-depth: ‘2’

    - name: Setup Python
      uses: actions/setup-python@master
      with:
        python-version: 3.7
    - name: Generate Report
      run: |
        pip install coverage
        coverage run -m unittest
    - name: Upload Coverage to Codecov
      uses: codecov/codecov-action@v2
The actions that matter to you are Generate Report action and Upload Coverage to Codecov. Generating the report looks just like it did when you generated it locally. Instead of running our tests with python, we run them with coverage.
Fortunately, Codecov has made the next part, uploading the data to Codecov for viewing, extremely easy with their codecov-action integration. You can read more about the options it offers in the documentation, but for a basic upload, all you need to do is tell the action to use version 2(@2) of the codecov-action repo, and it will take care of the rest for you. Once this file is in place, you can push your branch up to GitHub.
You’ll be able to see your actions running under the Actions tab on your GitHub repo. Once they’ve finished successfully, head over to Codecov to view your data.
Integrating into Pull Requests
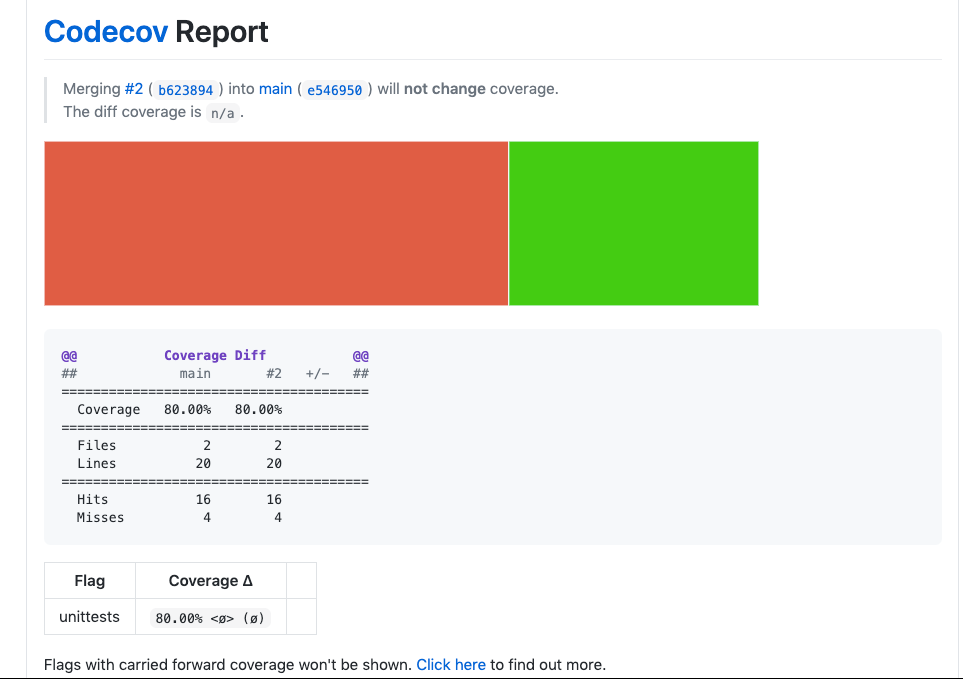
One great feature that Codecov offers is the ability to add coverage reports right in your github pull requests. All you need to do is add a codecov.yml file in the root of your project. The file can be empty, it just needs to exist. Now, next time you make a PR a coverage report will appear that looks something like this.
You can customize Codecov well beyond what we can cover in this tutoria, but one thing that will be helpful here is to tell Codecov to ignore your test files when creating a report. You can do that with ignores in your codecov.yml
ignore:
  - "*/tests/*”
The Pull Request Report
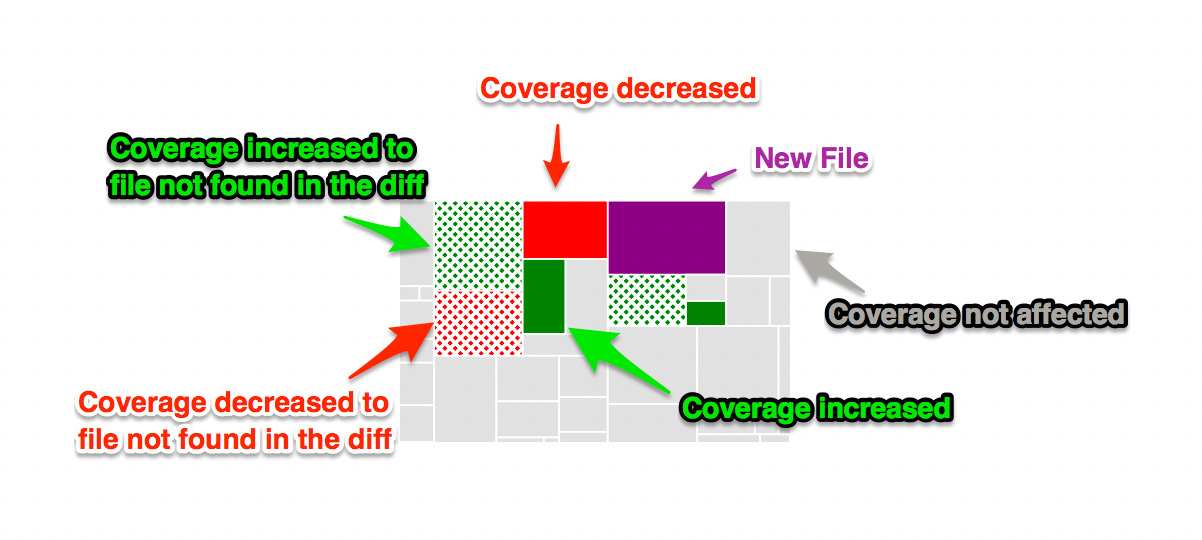
The coverage report in your PR will give you a bird’s-eye view of your project, taking into account how the PR will change your coverage score. You’ll see a large coverage reach graph. This graph will have a breakdown of how each file in your project stands in the light of this new PR. You can find a full breakdown of how to read the graph here, but the basics are that red will indicate a file where coverage has decreased and green will indicate a file where coverage has increased.
In addition to the graph you’ll see a small chart comparing scores from your main branch with scores once the new branch is merged. You’ll also be able to see the number of hits (lines covered by tests) versus the number of misses (lines your tests don’t touch) in both your main branch and with your new PR.
Your Codecov Dashboard
On your Codecov dashboard you’ll be presented with several options for interacting with your coverage data. The overview tab will give you a line graph showing your overall coverage percentage over time. Below that you’ll see a sunburst graph.
This interactive graph will allow you to navigate through files and folders to see how certain subsets of your project stack up when it comes to coverage scores. You’ll also see tabs for commits, branches, and pulls where you’ll be able to easily navigate through your project’s history, see old reports from past versions of the project.