Maintaining a test suite is like a slow-moving game of Tetris. If you stay on top of it, fixing one slow or flaky test here or there is easy, and your team can keep playing. But if you let them pile up, those small issues can start to slow things down until it feels like you’re one block away from a complete disaster.
Of course, the right tools make it easy to stay ahead of the game. I recently discovered this firsthand when I found some surprisingly slow tests in our Gazebo repo, leading to a simple fix that boosted our test suite speed by 10%. It may not sound like much, but every second waiting for tests to run brings you one cat video closer to completely losing focus.
Finding slow tests with Codecov Test Analytics
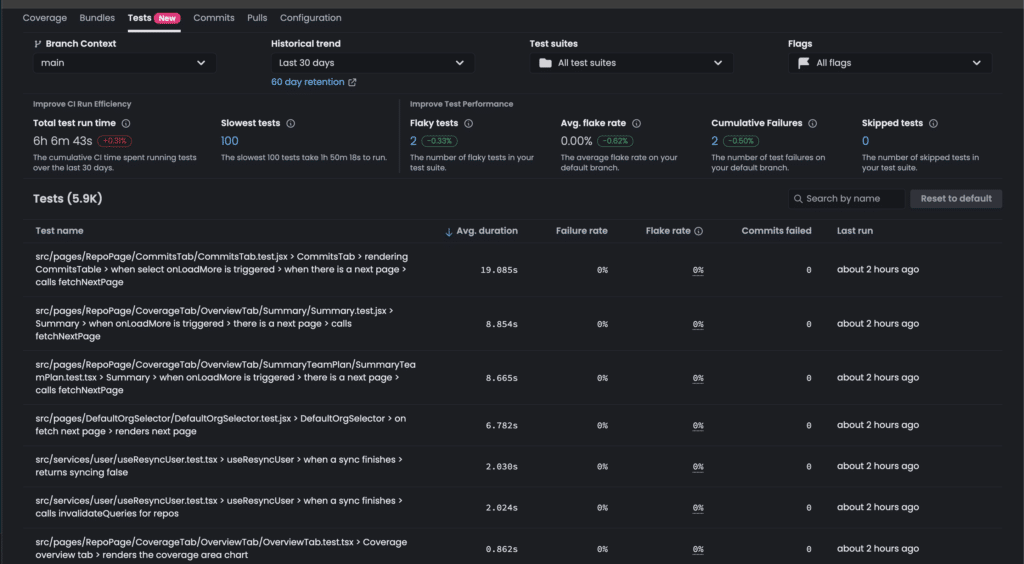
As part of my Friday afternoon checks, I was looking at our Test Analytics dashboard when I noticed a few tests taking over 5 seconds to run, with one being an even more abnormal 18 seconds. This looked like an opportunity to improve our test suite. Since the slow-running test names all contained when there is a next page, I suspected it was probably related to pagination mocks used in all of these tests, not the pagination code itself–especially given the lack of related Sentry issue alerts.
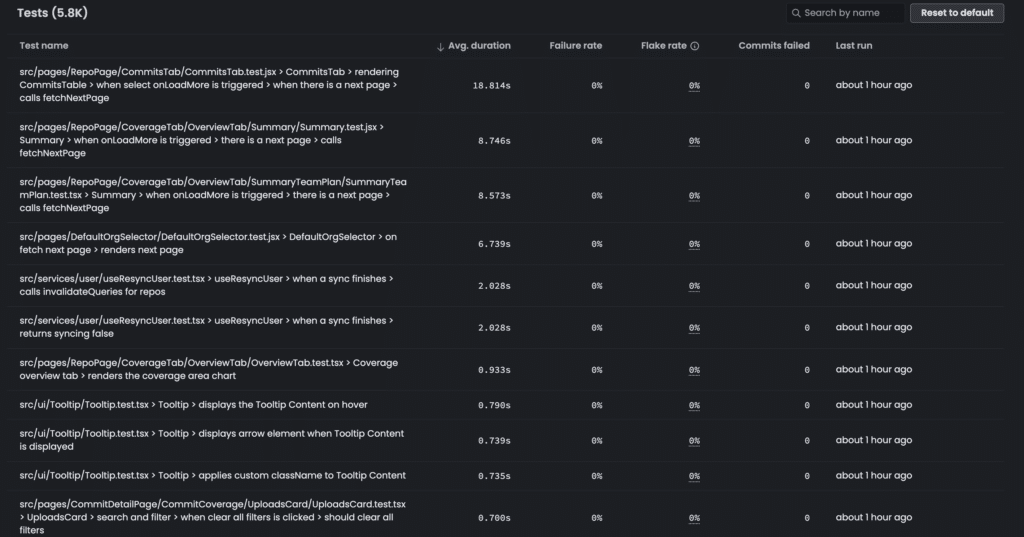
I was curious to see whether these high test times were ongoing, or might have been fixed recently, so I used the historical selector (found in the top row of filters) to narrow my search to the last 7 days. Even at 7 days I was seeing similarly high test times, indicating the issue was ongoing. Here’s what the 7-day list of slowest tests looked like:
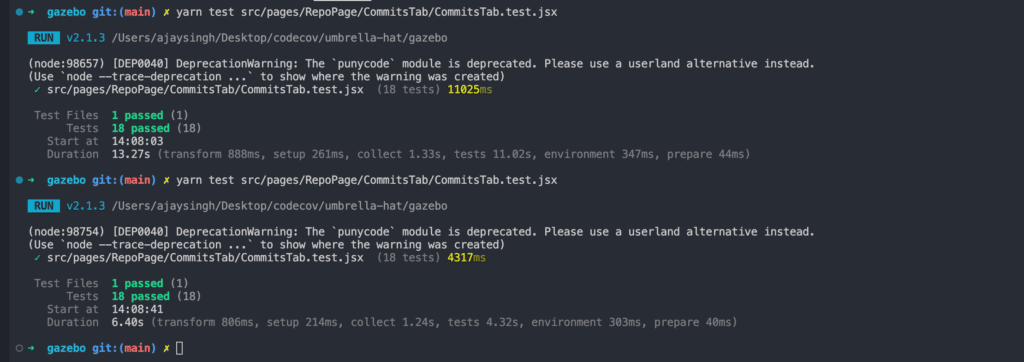
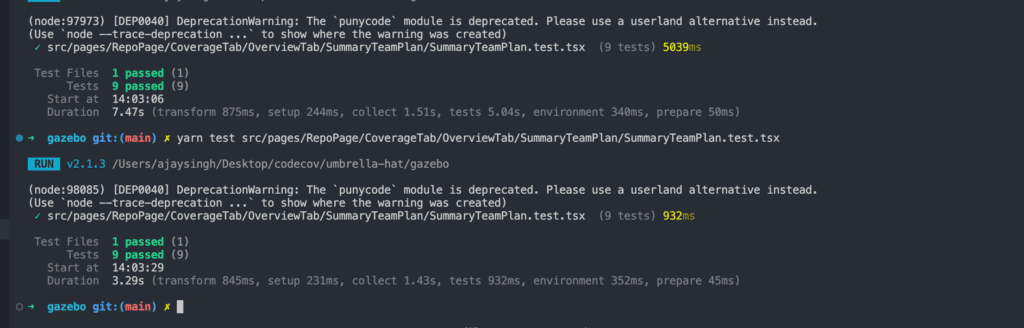
Next, I ran the Commit.jsx test suite locally to make sure the problem was in the tests themselves and not a CI issue. The local run confirmed it was the tests, with the suite run time routinely hitting 13 seconds.
Using Cursor to fix the tests
Now firm in my conviction that the problem was in the tests, I used Cursor to identify a possible fix.
My prompt: “Are there any aspects to this test that could be optimized, particularly with respect to how we’re handling fetching the next page of this API?”
Cursor immediately returned an answer pointing out an unnecessary mock. Turns out we’d been mocking the user action of scrolling to the bottom of a page that precedes an additional page of data being loaded, and we didn’t need to do that. The mock was adding unnecessary complexity and slowing the tests down.
Results
Removing that mock from the affected tests sped up each test by 50-70%, and the entire test suite sped up by 10%.
Takeaways & lessons learned
- Don’t skip naming your tests descriptively! Noticing the same text in each test name saved me a ton of time and effort. If the names had been generic, I would have had to investigate each test separately.
- Without the Codecov Test Analytics dashboard, I never would have caught this slowness, and we’d probably still be wasting test time on an unnecessary mock. While the amount of time I dealt with here isn’t really a deal breaker, little issues like this can add up over time and create big slowdowns.
- Cursor saved me hours of investigation and coding. Yes, you need to check its work, but it’s a huge productivity boost.
- By combining Codecov Test Analytics and Cursor, this whole process took me a little under an hour. I saved a few hours in the moment, and over time our team will save a ton of testing time.
Learn more about Codecov Test Analytics and try it for yourself with a free trial. Or join the conversation in Discord