No one likes digging through logs to figure out why a test failed. Even less fun: wasting time on flaky tests. That’s why we made Test Analytics – a new set of tools that call out flaky tests and tell you exactly why a test failed all in the PR comments. It’s now generally available with your Codecov plan.
Say no more. Take me to the docs!
When a test fails, and you’re not entirely sure it’s a flaky test, what do you do? You re-run it, right? What a total waste of time! Refreshing your browser every 30 seconds to see if the test passed the second time even though you already know this process is a roughly 30-minute wait-and-see process. Flaky tests make your entire CI pipeline unpredictable and keep you from mashing the merge button and moving on to the next issue/feature/task.
With Test Analytics, you can spend less time debugging test failures because Codecov will tell you why they failed or if they’re flaky as soon as the test fails in your PR. Better yet, now you can do your team a massive favor and fix those flaky/broken tests to save everyone the headache. If you’re looking for more, you can get a full list of frequently failed tests and flaky tests in Codecov – add those to your backlog and then humble brag about fixing them. Failed test detection and analytics are included with all Codecov plans.
To get flaky test detection and analytics on private repos, you’ll need to be on a Pro or Enterprise plan. Continuing our commitment to support open source, flaky test detection and analytics are included for public repos on all plans.
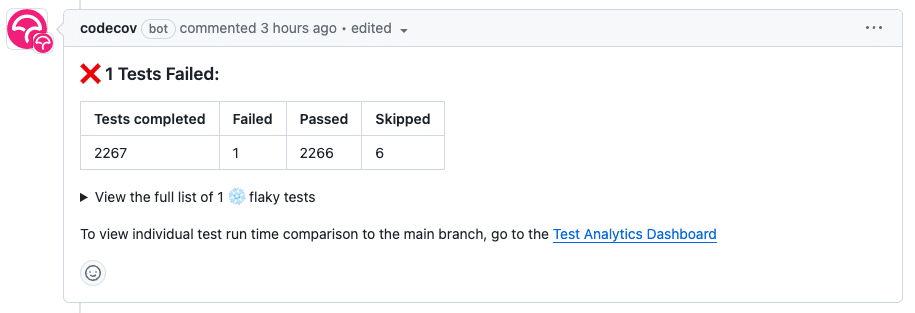
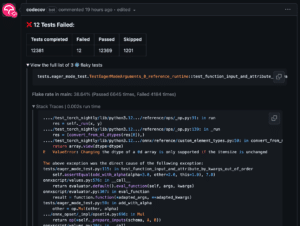
Test Analytics in the PR Comment
The updated Codecov PR comment tells you if your PR is failing due to an issue with your proposed code changes, or due to a systemic flaky test. Without opening another tab or window, see the line(s) failing, commit a fix, or simply re-run the test and 🤞it passes on the second or third try. With the GA release, you’ll be able to see the stack trace associated with a flaky test, and the test name and stack trace are copy & pasteable so you can re-run the test locally right away.
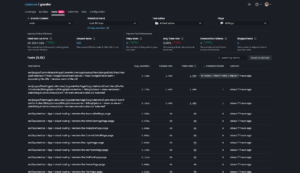
Tests Dashboard in the Codecov UI
A CI that runs slowly, or is being constantly re-run isn’t just annoying, it’s expensive. When your monthly CI minutes get drained prematurely, the accountants start asking questions, and engineering managers have to find the answers. It’s probably better to get ahead of CI time sinks in the first place.
To help you plan your test suite optimizations, we added Test Analytics into the Codecov UI. Here, you’ll see a summary of the tests in your test suite, selected to help you understand just how much your tests may be impacting CI performance and developer experience.
CI taking too long? Take a look at your total test suite run time, and drill into your top slowest-running tests. Prioritize test changes by average duration, failure rate, or last run.
If flaky tests are causing endless re-runs of your CI, drill into the flaky test count or skipped tests, and sort by flake rate to tackle the flakiest tests first.
Free Basic Test Results GitHub Action
If you’d like to test the waters before signing up, we created the Basic Test Results GitHub Action. It gives you just the essentials—test failures and a stack trace in your PR for faster debugging. It’s free and doesn’t require a Codecov account.
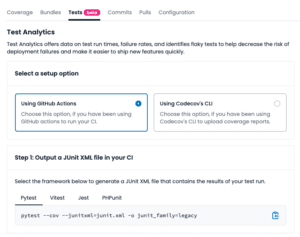
Getting Started with Test Analytics
If you’re already using Codecov, all you need to do is:
- Instruct your test runner to output a test result file in `junit xml` format
- Upload test results using the Codecov Test Results Action, or the CLI
- Create a new commit and you’re good to go!
You can also find this information in-app by navigating to the new tests tab.
You can find all the information, instructions, and prerequisites you need in the Test Analytics Guide. Looking for a real working example? Take a look at how we set up Test Analytics on Codecov’s Front-End project.
*Just a heads up, Test Analytics is in beta and free to use during this period. When we GA Test Analytics, failed test detection will be included on every plan and flaky test detection will be available on our Pro and Enterprise plans.
Not using Codecov yet? Get started.
Join the Conversation
Test Analytics is now generally available for all Codecov users. Experience the difference it makes in streamlining your test management process and accelerating your code review cycles. Say goodbye to tedious test failure diagnosis and hello to a smoother development workflow.
If you have thoughts or suggestions, don’t hesitate to share them with us on GitHub.