Several years ago, I worked at a company with a legacy codebase that was written before automated testing was popular. Releases took place once a month. The entire week before release, two QA engineers would manually run through a test suite written in a Word document, trying to make sure every part of the application worked. What they needed was an automated test suite that could be measured and improved over time—and didn’t require that tedious manual process.
A test suite is a collection of unit, integration, and end-to-end tests used to check that your application is running as expected. These tests reassure developers that their changes won’t break something in production.
When your test suite isn’t working well, trust is quickly eroded. Tests take a long time to run, randomly fail, or just don’t catch bugs. At this point, your test suite is no longer a helpful tool but a nuisance that needs to be dealt with.
This article explores metrics for tracking the effectiveness and overall health of your test suite. You can use these metrics to guide your test suite maintenance efforts and ensure your test suite is improving code quality and speeding up development.
*Note:* The sample configurations in this article have been published to the theBenForce/test-suite-effectiveness repository. You can also view the reports generated from these samples on Codecov.
Why Measure Test Suite Effectiveness
A good test suite identifies bugs quickly and consistently before they hit production. It’s able to give a clear indicator of where an issue is when it comes up. It should be fast so that you can run it frequently. It should also be easy to maintain so that you don’t have to spend a lot of time keeping it up-to-date.
Test effectiveness metrics help ensure you have a robust test suite. A consistent, effective test suite helps identify bugs before they reach production, which improves both developer confidence and customer satisfaction.
Unless you’re working on a greenfield project, developers usually make changes to very complex systems that have been built over the years. Tech debt lurks in forgotten places of the project, written by someone who no longer works at your company.
When you make changes to a project like this, you typically spend a lot of time investigating all the possible side effects of those changes. However, if you know your test suite will find these issues for you, you can be less hesitant to push your changes.
And when you introduce a new bug—because it’s guaranteed to happen at some point—an effective test suite running in a CI/CD pipeline can stop it from getting deployed to production. It can also ensure that a regression of that bug doesn’t show up during a simple refactor.
How to Measure Test Suite Effectiveness
Let’s explore nine metrics of test suite effectiveness. They’re broken down into three groups that cover code, test, and suite analysis.
Code Analysis Metrics
While code analysis metrics don’t directly monitor your test suite, they provide indicators of your source code’s health and testability. Let’s start with a metric that you may already be tracking: code coverage.
Code Coverage
The most basic test effectiveness metric is code coverage—how much of your codebase is covered by tests. Even though this metric doesn’t make any assertions about the correctness of your tests, it’s useful for identifying areas of your code that aren’t being tested.
To collect code coverage, you’ll need to configure your test runner so that it knows where your source files are and what format to use for the coverage report. When you run your unit tests, you’ll then get a file that describes which lines of source code are used by which tests—and which ones aren’t tested.
The following snippet shows how to configure jest to collect code coverage from your src directory and generate a report:
/** @type {import('jest').Config} */
const config = {
collectCoverage: true,
collectCoverageFrom: [
"src/**/*.{ts,tsx}",
],
coverageReporters: ['lcov', ['text', {skipFull: true}]],
};

module.exports = config;
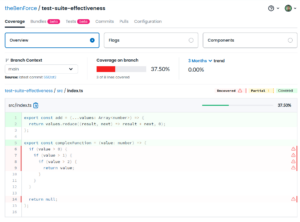
After you’ve generated this report, you can use Codecov to analyze the report and find areas that need more testing.
Code Complexity
The cyclomatic complexity score is a count of how many possible execution paths there are through your code. A higher score indicates that a function will be difficult to work on because you have to keep more conditions in your mental model.
If you have a function with a high complexity score (anything over 20), try to break it into smaller functions to make it easier to understand. Once you can’t break it down anymore, use the complexity score as an indicator of which code sections need more tests.
The easiest way to measure cyclomatic complexity is through a linter. For example, the JavaScript linter ESLint has a complexity score built in. Once you’ve configured the maximum allowed complexity score, your linter will automatically highlight any functions that are too complex.

JavaScript Bundle Analysis
The larger your JavaScript bundle is, the longer it will take a browser to download and execute. How long your website takes to load is a big part of the first impression you make with future customers. In fact, if it doesn’t load within two seconds, almost half of those potential customers will leave.
A bundle analysis shows which dependencies are causing your final build to be larger. With the tangled web of npm dependencies, a bundle analysis can help you find large dependencies that you didn’t even know you were using. When you check a bundle analysis as part of a merge request pipeline, you can catch bundle-size issues before they become a problem.
Some bundlers have simple analysis tools built in. For example, esbuild will show a basic analysis on the CLI when you pass the --analyze flag. For more in-depth bundle insights, you can try a third-party tool like Codecov’s Bundle Analysis.

Test Analysis Metrics
The next three metrics analyze the effectiveness of your tests. Let’s start with a metric that directly checks that your tests are checking results correctly: the mutation score.
Mutation Score
Even if your code coverage shows that you’re testing every line of code in your project, you won’t necessarily catch every bug.
In the following simple example, you’re testing every line, but your code doesn’t work as intended:
export const add = (...values: Array) => {
return values.reduce((result, next) => result + next, 0);
};

it("should return a value", () => {
const result = add(1, 1);
expect(result).toBeDefined();
});
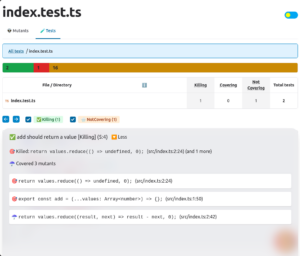
Mutation testing purposefully injects bugs (referred to as *mutants*) into a codebase and runs your unit tests against that broken code. It generates a score based on the percentage of bugs that your tests caught (or *killed*) using this calculation:
score = (mutants killed / (total mutants)) * 100
A low mutation score tells you that your unit tests aren’t effective at catching bugs. For example, mutation testing would take the add function above and change the return statement to something like return values.reduce((result, next) => result - next, 0) and then run your tests. Since the "should return a value" test passes, your unit tests would have a low mutation score.
Reports from mutation testing tools like Stryker can tell you which tests should’ve caught the mutant so you can update them.
Failed and Flaky Test Analytics
Have you ever had a failed test job in a pipeline to which the solution was to “run it again”? If so, you know firsthand what flaky tests are.
Flaky tests erode confidence in the tests. If a test fails, you don’t know whether the test simply needs to run again or if there’s a bug that you need to look for. Rerunning your tests over and over slows you down and eats up pipeline resources.
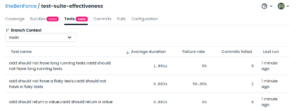
Identifying flaky tests can be difficult without a tool like Codecov that identifies them for you. To set it up, you need to modify your test runner to output its results as a report file, then upload those results as part of a CI/CD pipeline.
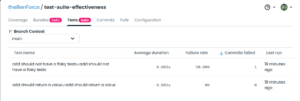
After you set it up, you’ll be able to see each test’s failure rate by branch. A high failure rate on your default branch indicates a flakey test.
Test Suite Execution Time
Test suites that take a long time to run are used less by developers, and they eat up more compute minutes in your pipelines.
If you’re working on a project with a test suite that executes quickly, you can run it after every change you make, which, in turn, makes it easier and faster to fix issues. If the test suite takes a long time to run, you’ll likely wait to run it until your merge request pipeline forces you to.
Tracking test suite execution time helps you find slow-running tests and fix them. It can also catch changes that slow down the performance of the code being tested.
If you use Codecov, it will track the duration of your individual tests. You can then view these durations in a dashboard to see which tests need to be worked on.
Test Suite Analysis Metrics
The final three metrics are measured using your ticket tracking system. They track how your test suite is actually being used.
Defect Detection Rate
Defect detection rate shows how many bugs your test suite keeps out of production compared to how many are released. It’s a ratio calculated using the following formula:
Defect Detection Rate = (Bugs Found by Tests / Total Bugs Found) * 100
Tracking the defect detection rate will show you how well your test suite is protecting customers from bug releases. This metric will either improve developer confidence in the test suite or tell you that it needs some maintenance.
You can track defect detection rate in your issue-tracking system by adding a source field to your bug issues with testing or customer as values. After tracking this field for a couple of release cycles, you can generate a report that shows bugs caught by testing compared to those customers caught.
Fault Isolation Effectiveness
When a test fails, you want to find the source of that failure quickly. How well your test suite helps you find the source of the bug is called fault isolation effectiveness. The better your test suite is at this, the more efficient you will be at fixing bugs when they’re found.
You can also track this metric using an issue-tracking system. Add two custom fields to your bug issues—one to track where the test suite indicates the source of the bug is and another to track where the problem was actually fixed.
After you’ve been tracking the bug source and actual location for a few release cycles, you can calculate how effective your test suite is using the following formula:
Isolated Bugs = count(test-suite-location == actual location)
Fault Isolation Effectiveness = (Isolated Bugs / Bugs with Location Set)
Test Maintenance Effort
Test maintenance effort is the amount of time you spend updating your test suite. Healthy tests are reliable and easy to update, meaning they don’t require a lot of maintenance.
Your higher-level tests (end-to-end or integration) are more complex and, therefore, more sensitive to changes in your application. This means they usually require more maintenance, which is why the test pyramid suggests fewer of these tests.
While unit tests are simple, there are generally a lot of them. This means you could have a lot of poorly written tests, each one breaking in its own way. A change to one line can snowball into updating dozens of unit tests, adding to your maintenance effort.
The best way to track test maintenance effort is to tag tickets in your issue-tracking system. After a couple of sprints, you can start generating a report showing the number of tickets opened to update your tests. Track this report over time to see if your test maintenance effort is improving.
Measure Test Metrics with Codecov
Tracking the metrics discussed in this article and doing regular maintenance on your test suite help increase developer confidence in test results and reduce the time needed to fix bugs.
A platform like Codecov simplifies the process of measuring these metrics. It provides bundle analysis and code coverage badges, identifies flakey tests, and adds information about your test results as comments on pull requests. Try it out to see how simple it is to track the health of your test suite.
P.S: A high-functioning test suite is great, but your team needs to use it properly! There’s a workshop about building testing culture that might help.
